 |
Roads in Massachusetts*
are salted in the winter to de-ice them, frequently with NaCl
(sodium chloride), sometimes with CaCl2 (calcium chloride).
The question arises whether the salt, carried by melt-water
runoff from the road, affects plants growing in the vicinity,
or aquatic systems where the runoff goes.
The following list of questions and answers provides you
with a model for how you might set up an experiment with TACs. |
 |

What question are you exploring?
Are plants affected by runoff from roads de-iced with salt in
the winter?
What specific idea (hypothesis) are you testing?
Higher concentrations of salt (NaCl) negatively affect plant
growth.
What variable will you change in your experiment?
The concentration of NaCl in water fed to plants.
What variables will remain constant in your experiment?
Type of soil, water, and plants, age of plants, and salt treatment
schedule. Physical conditions such as temperature and light.
List all the items you will need:
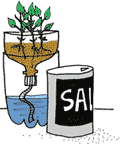
- four TACs filled with 50 ml of water below and equal amounts
of a potting soil above
- seeds of grass, Fast
Plants, radishes, or other fast-growing plants
- four labels
- salt – Use road salt, lab grade NaCl, pickling or kosher
salt. Table salt often contains iodine and "flowing agents" that
may affect results
- eye dropper
- soil testing kit to monitor soil pH (optional)
What is your experimental procedure?
- Plant seeds in four TACs.
- After plants have sprouted, label one column CONTROL, label
a second 0.1% NaCl, a third 1.0% NaCl and the last TAC 5.0% NaCl.
- Prepare salt solutions of 0.1%, 1.0% and 5.0% salt by weight.
(For example, 0.1% is one tenth of a gram of salt per 100 ml of
water, or 1 gram of salt per liter of water.)
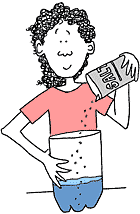
- Treat each TAC with 10 ml of the appropriate salt solution.
Use an eye dropper to place 5 ml on the soil and 5 ml in the reservoir.
Treat the CONTROL with plain water.
- Treat plants every fourth day for a month.
- Observe and record plant development, including height, leaf
number, size and color. You might also take pictures of the plants
to monitor changes in color and other aspects of physical appearance.
- Test the soil pH
- Repeat this experiment, or run several at once. Can you reproduce
your results?
Do the results of your experiment support your hypothesis?
The Medfield High School students found that the higher salt
concentrations had more negative effects on plant growth and development.
Discuss your experience with others. Write a report and create
a graph to illustrate your investigation.
*Whitney Hagins and Judith Noble and their classes
at Medfield High School in Medfield, MA designed this experiment on
salt pollution.
|

